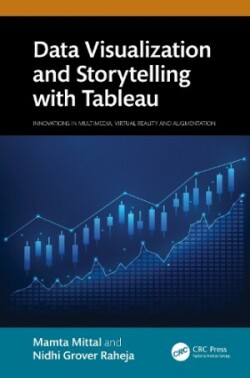
Data Visualization and Storytelling with Tableau

Data Visualization and Storytelling with Tableau

EnglishHardbackPrint on demand
Mittal Mamta
Taylor & Francis Ltd
EAN: 9781032552224
Print on demand
Delivery on Friday, 7. of August 2026
CZK 4,644
Common price CZK 5,160
Discount 10%
pc
Do you want this product today?
Megabooks Praha Korunní
not available
Librairie Francophone Praha Štěpánská
not available
Megabooks Ostrava
not available
Megabooks Olomouc
not available
Megabooks Plzeň
not available
Megabooks Brno
not available
Megabooks Hradec Králové
not available
Megabooks České Budějovice
not available
Megabooks Liberec
not available

Detailed information

Tableau, one of the most widely used visualization tools, helps in illustrating the ideas of data visualization and storytelling. Through Tableau’s Data Visualization and Storytelling feature, aspiring data scientists and analysts can develop their visual analytics skills and use them in both academic and business contexts.

Data Visualization and Storytelling with Tableau enables budding data analysts and data scientists to develop and sharpen their skills in the field of visual analytics and apply them in business scenarios as well as in academic context. This book approaches the Data Visualization workflow from a practical point of view, emphasizing the steps involved and the outcomes attained. A major focus of this book is the application and deployment of real-time case studies. Later chapters in this book provide comprehensive coverage for advanced topics such as data storytelling, data insights, color selection in graphs, publishing in tableau public, and misleading visualizations. Thus, this book emphasizes the need to visually examine and evaluate data through stories and interactive dashboards that are made up of appropriate graphs and charts. The case studies covered in this book are a natural extension of the visualization topics that are covered in each chapter. The intention is to empower readers to generate various dashboards, stories, graphs, charts, and maps to visualize and analyze data and support decision-making in business. Advanced charts that are pertinent to project management operations are also thoroughly explored, including comparison charts, distribution charts, composition charts, and maps. All these concepts will lay a solid foundation for data visualization applications in the minds of readers.

This book is meant for data analysts, computer scientists/engineers, and industry professionals who are interested in creating different types of visualization graphs for a given data problem and drawing interesting insights from the plotted trends in order to make better business decisions in the future.

Features:

  • Introduces the world of Business Intelligence to readers through visualizations in Tableau.
  • Discusses the need and relevance of each business graph with the help of a corresponding real-time case study.
  • Explores the art of picking a suitable graph with an appropriate color scheme for a given scenario.
  • Establishes the process of gaining relevant insights from the analysis of visualizations created.
  • Provides guidance in creating innovative dashboards and driving the readers through the process of innovative storytelling with data in Tableau.
  • Implements the concept of Exploratory Data Analysis (EDA) in Tableau.
EAN 9781032552224
ISBN 1032552220
Binding Hardback
Publisher Taylor & Francis Ltd
Publication date June 28, 2024
Pages 460
Language English
Dimensions 234 x 156
Country United Kingdom
Authors Mittal Mamta; Raheja, Nidhi Grover
Illustrations 15 Tables, black and white; 130 Line drawings, black and white; 531 Halftones, black and white; 661 Illustrations, black and white
Series Innovations in Multimedia, Virtual Reality and Augmentation
Manufacturer information
The manufacturer's contact information is currently not available online, we are working intensively on the axle. If you need information, write us on [email protected], we will be happy to provide it.